When you use the Analysis > Create New function or click on ![]() in the Analyses section (navigation area), a wizard opens. Step by step, this wizard helps you to create a new analysis.
in the Analyses section (navigation area), a wizard opens. Step by step, this wizard helps you to create a new analysis.
All the settings of an opened analysis are saved under Configuration (Configuration area). To edit settings, click there in the corresponding section on![]() .
.
New analysis
First enter the basic settings of the analysis.
First / Second level of analysis |
Levels of analysis are used to structure the data of an analysis. Select at least one level, the second level is optional. The available fields depend on whether a programme analysis or an unrestricted analysis is created.
|
||||||
Budget structure |
If the field Programme budget structure is selected in one of the analysis levels in a programme analysis, one of the budget structures available in the programme must be selected here. |
||||||
For a programme analysis, a programme budget can optionally be selected, which provides the target figures for the analysis. |
|||||||
Level of detail |
If the field Account is selected in one of the analysis levels in a programme analysis, Level of detail can be used to select whether the expenses are grouped into main accounts or programme sub-accounts. In a programme analysis, if the Programme budget structure field is selected in one of the analysis levels, Level of detail can be used to select at which budget level grouping is to take place. When a budget is selected, the budget setting is applied. |
||||||
Display |
Change the setting if you want to display only the number or only the name of the budget lines. |
||||||
Currency type |
Select which currency the amounts are displayed in the analysis. When a budget is selected, the budget setting is applied.
|
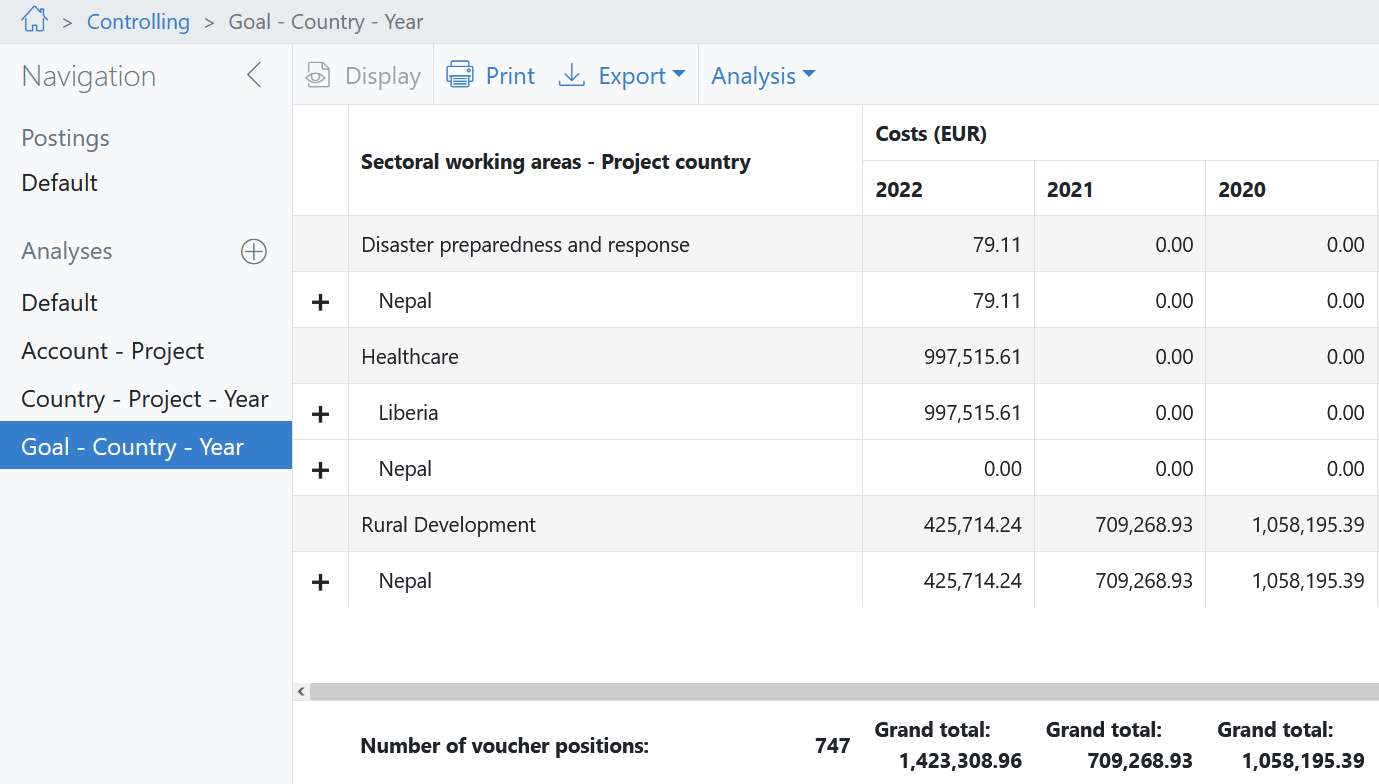
Table columns
On the next page of the wizard, you adjust which columns are to be displayed in the analysis. Depending on the previous settings, different table columns are available on the left:
Column |
Contents |
Column availability |
|---|---|---|
Costs |
Displays the total costs of all the posting positions that are subordinate to the table line (minus income, if applicable). The currency is the set Type of currency and is displayed in the column header. |
The column is always available. It is only available in the currency that corresponds to the Type of currency of the analysis: Local currency, reporting currency or voucher currency. |
Budget |
Displays the budget of the table row in the currency of the analysis. The latest version of the budget is always used. Historicised versions are not available. |
The analysis must be assigned to a budget. |
Residual budget |
Displays the remaining part of the budget in the currency of the analysis. The value is calculated as follows: Residual budget = budget - costs + income |
The analysis must be assigned to a budget. |
Residual budget (%) |
Shows what percentage of the budget is still available. The value is calculated as follows: Residual budget in % = (budget - costs + income) / budget x 100 If the value is negative, the budget has been exceeded. |
The analysis must be assigned to a budget. |
Budget spent (%) |
Shows what percentage of the budget has been used. The value is calculated as follows: Budget spent in % = (costs - income) / budget x 100 If the value is greater than 100%, the budget has been exceeded. |
The analysis must be assigned to a budget. |
Status of residual budget |
A traffic light system shows how much residual budget is still available in %. You can set the limits for the colours yourself. To do this expand the Status of residual budget column in the wizard. Use the sliders to adjust the percentage values. In the following example, all the lines with less than 5% residual budget are marked in red. Values from 5 to 30 % are marked in yellow. Lines with more than 30 % residual budget are marked in green:
|
The analysis must be assigned to a budget. |

With a double click or the Add selected table column (>) button you can add columns to your analysis. You can also add columns multiple times.
Drag columns on the right to the desired position, or use the Up or Down buttons.
Column groups
Use the function create column group (![]() ) to break down several columns at the same time, for example, the Costs and Budget columns broken down by accounting periods.
) to break down several columns at the same time, for example, the Costs and Budget columns broken down by accounting periods.
Example:
2020/06 |
2020/07 |
2020/08 |
|||
Costs |
Budget |
Costs |
Budget |
Costs |
Budget |
1000 |
1200 |
800 |
1200 |
1500 |
1200 |
To add columns to a column group, simply drag and drop them into a column group in the Table columns of the group field. In the Breakdown field, select the time period for the breakdown. Set the Sorting and decide in the Display field, whether absolute or relative values are to be displayed. Depending on the column, the field may be preset.
To delete a column or a column group, select it and click on Remove (![]() ).
).
NOTE: Column groups are not available for analyses without a budget, as only the Costs column is available. |
Breakdowns
Expand the settings for individual columns (![]() ) to break down their contents.
) to break down their contents.
Breakdown |
Select a time period or property of the project by which the data is to be broken down. |
Sorting of breakdown |
Specify whether the data should be sorted in ascending or descending order. |
Display |
Choose between absolute numbers or relative values in percent. |
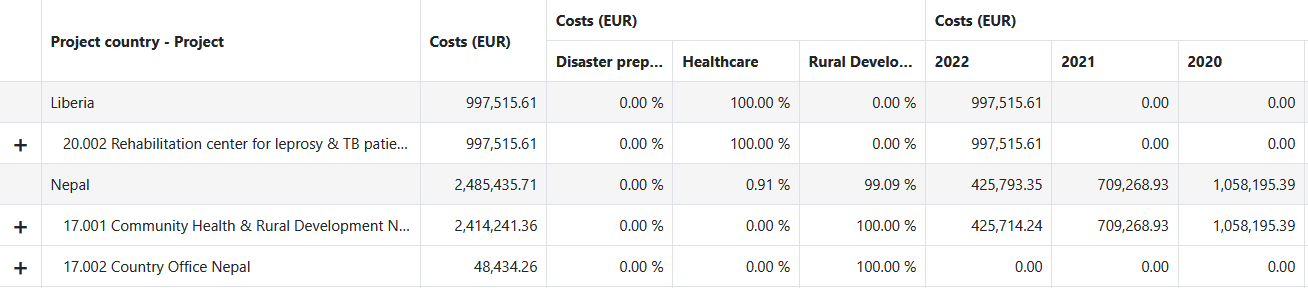
In the following example, the analysis contains the Costscolumn three times:
▪without breakdown, to show total cost
▪broken down by sector, relative values
▪broken down by year, absolute values
Filters
Filters allow you to restrict the data basis of the analysis to specific values. Each filter consists of any number of conditions with the three Column, Operator and Value settings. You can set whether one or all conditions must be fulfilled.
Use the Add condition (![]() ) function to add conditions to a filter. You can remove conditions with
) function to add conditions to a filter. You can remove conditions with ![]() .
.
Example: In the analysis, you’d like to include all the expenses for vaccinations up to and including the 2021/02 accounting period, which is between EUR 50,00 and EUR 200,00.
Column |
Operator |
Value |
|---|---|---|
Account |
is equal to |
Vaccinations |
Accounting period |
is less than or equal to |
2021/02 |
CC amount |
is between |
50,00 and 200,00 |
Under Linking the filters select All the conditions must be fulfilled to combine the conditions.